Laura Ullrich, Economic Research Director

Indeed’s Best Cities for Work
August 25, 2026
Finding a role that matches your skills and experience is essential. It’s what we do at Indeed. But we also know that life exists beyond your job. Where and how you work matter, too—from housing costs and healthcare access to commute times, flexibility and opportunities to grow. Together, these factors shape whether a job truly works for you.
That is why we launched Indeed’s Best Cities for Work: our first-ever comprehensive ranking of U.S. metropolitan areas. We want to help job seekers and workers make better-informed decisions for their careers and lives.
Having spent part of my career at a regional Federal Reserve Bank, I’ve seen firsthand how local economies and community infrastructure dictate economic opportunity. That background made helping develop this ranking deeply personal for me. As local labor dynamics shift, this index will evolve—offering a clear lens into how American cities foster growth now and in the years ahead.
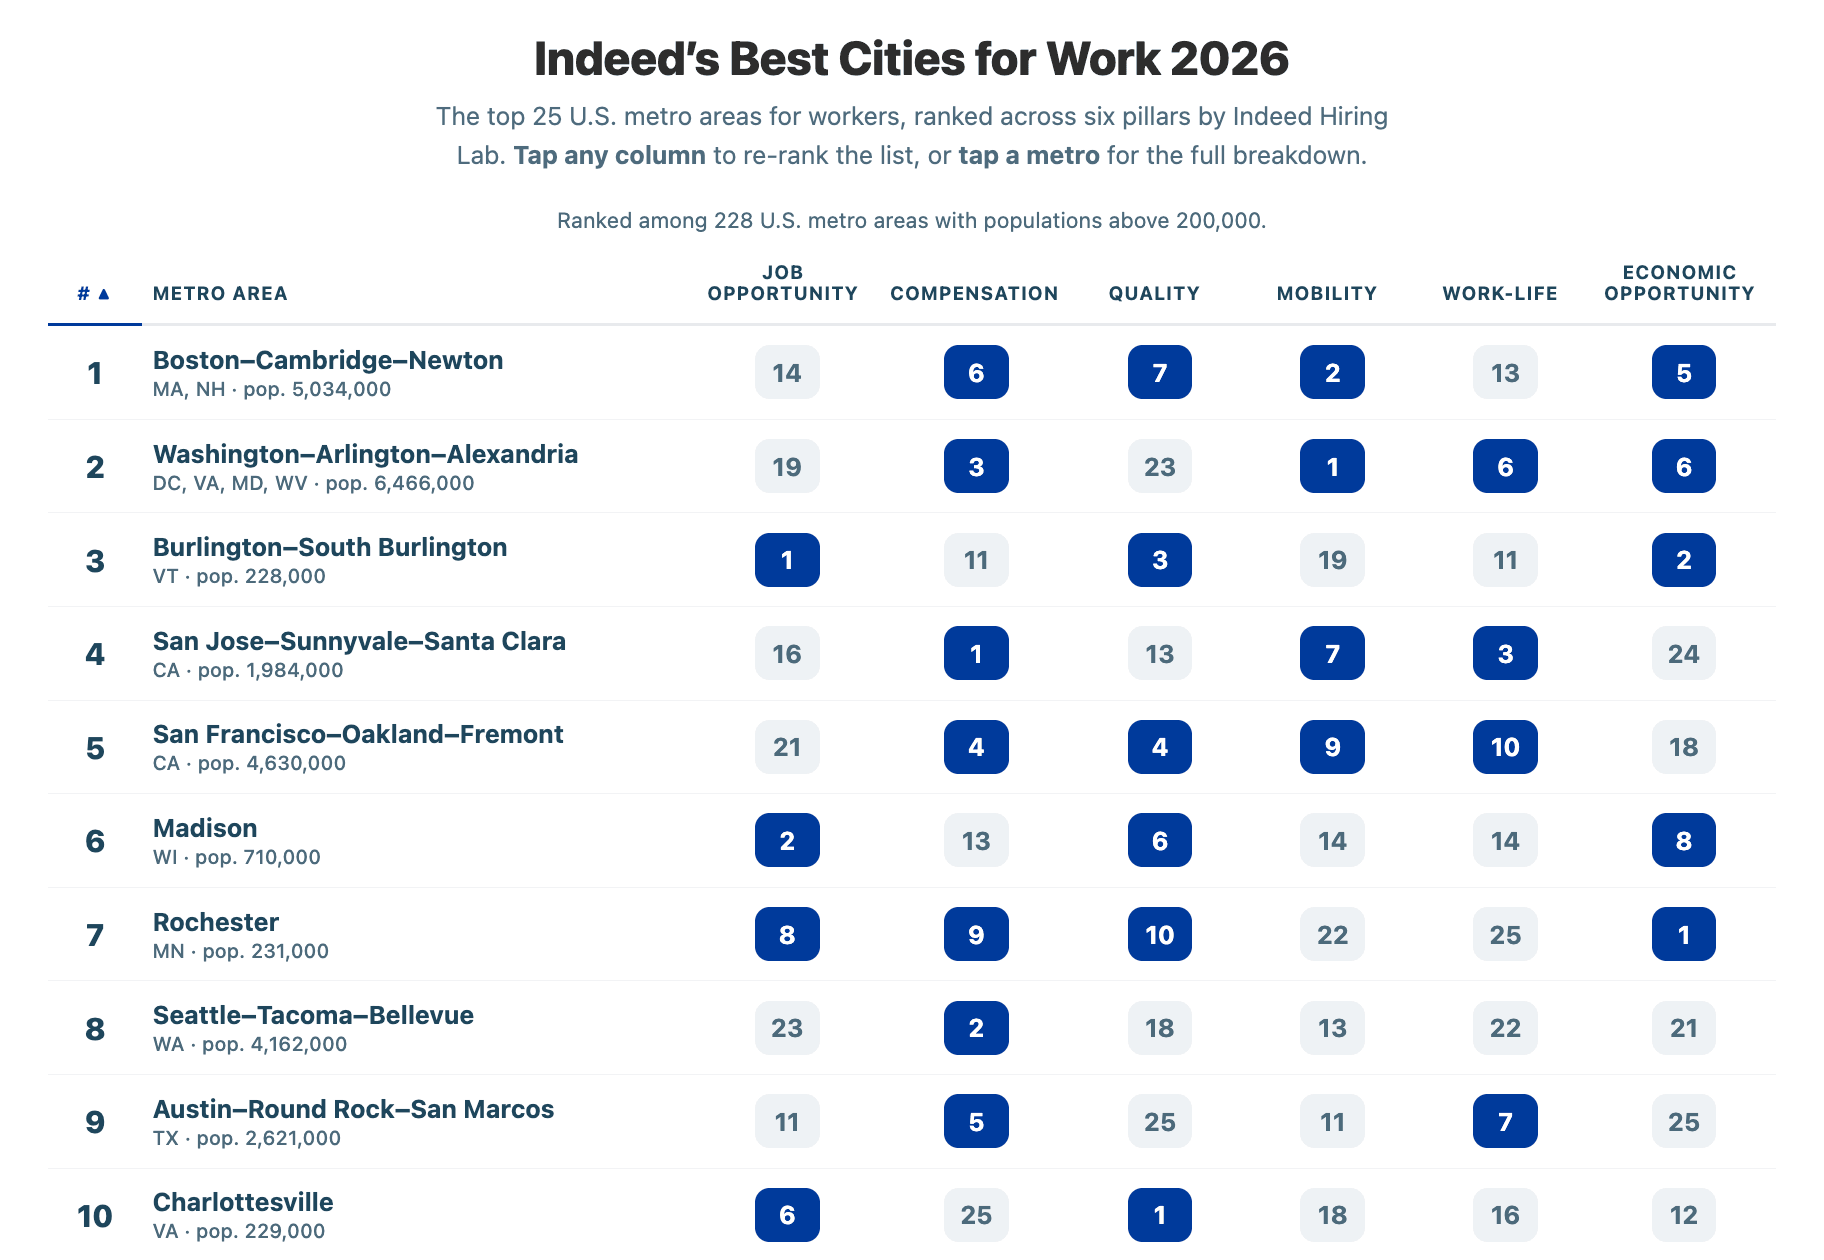
Boston Ranks #1 and Other Standout Cities
At the top of the list, Boston stands out for its access to healthcare and education, high earning potential, and walkability. Its strong combination of career and economic opportunity gives workers the resources they need to thrive both professionally and personally.
Many of the cities on the list also share another common thread: major healthcare institutions and universities. These institutions attract talent, businesses and investment that extend well beyond their campuses, helping fuel the broader economy. Living in a college town like Boston, Ann Arbor or Madison creates a built-in ecosystem of students, faculty and young professionals, making it an attractive place to open a coffee shop, launch a business or invest in a growing company.
What surprised me most about the list was its diverse mix of cities. From smaller metros like Cedar Rapids to major tech hubs like San Francisco, the ranking features many cities that workers might not typically consider. Burlington, VT, for example, has a population of just 228,000 but landed in the top three, driven by its strength in Job Opportunity, Job Quality & Security, and Economic Opportunity. This signals that, despite its smaller size, it offers workers a strong environment to build a career, with job stability and wages that hold up well against the cost of living.
What Is the Best Cities for Work List?
Built on real-time labor market data, Indeed’s Hiring Lab evaluated over 200 U.S. metro areas (populations 200,000+) and 40 trusted data sets to identify the top 25 cities where workers truly thrive based on six core pillars: Job Opportunity, Compensation, Job Quality & Security, Career Mobility & Dynamism, Work-Life & Flexibility, and Economic Opportunity.
As a leading job platform, Indeed helps people at all stages in their career. We combine data from millions of job postings and expert economic research to see cities the way workers experience them. This scale and depth allow us to deliver a uniquely comprehensive and trusted ranking.
Beyond the overall rankings, job seekers and workers can explore individual pillars to match their priorities – including housing costs, healthcare access, and restaurant density. Whether someone is chasing early-career mobility, navigating childcare costs, or seeking better work-life balance, this list helps evaluate what matters most right now.
What This Means for The Workforce
- For job seekers and workers the rankings offer a data-driven look at top cities for career potential and livability. To provide consistency and allow for use of better metrics, we consider the entire metro area in which the city resides. Workers can benchmark local standards for the six pillars, including pay, benefits, and flexibility to negotiate better offers or evaluate their current role against market norms.
- For employers the list highlights a region’s talent competitiveness beyond base salary. When local factors like housing or commute times fall short, companies can sharpen their offer and attract talent by emphasizing remote flexibility, stronger benefits, and career advancement.
- For Local Government and Business Leaders the index serves as a blueprint for regional growth, helping leaders target investments in housing affordability, public transit, workforce training, and childcare to build thriving economic ecosystems.
Connecting People to Better Work
At Indeed, our mission is to help all people get jobs. By launching the Best Cities for Work list, we are expanding that commitment and connecting people not just with open roles, but with communities where their careers and daily lives can genuinely thrive.
Methodology FAQ
How was this list determined? What is your methodology?
The Best Cities for Work 2026 index scores 40 metrics across six pillars for 228 U.S. metros with populations above 200,000. Each metric is put on a common scale so metros can be compared fairly, with outliers trimmed and every measure pointed the same direction — so a higher score means better for workers (including the ones where less is better, like long commutes or AI exposure). The six pillars are weighted 20 / 20 / 15 / 15 / 15 / 15 with Job Opportunity and Compensation carrying the most, because a job you can get and a wage you can live on are the preconditions for everything else. Within each pillar the metrics are weighted equally, except Pillar 1, which leans hardest on labor-market tightness. The index is built on Indeed’s proprietary data combined with public sources. The full construction, every metric, and every source are in the published methodology.
How often will this list be updated?
This is the inaugural edition that’s built on the most recent data available. We are evaluating plans with the goal of updating it annually.
Why did you use this population minimum?
Setting the bar at 200,000 keeps every estimate stable to compare fairly, while still covering the 228 metros where the majority of Americans live and work. For the metros below about 200,000 people, many of the metrics get noisy, survey samples thin out, and posting-based measures (like tightness or wage growth) swing on small numbers.
Why does the list look at metro areas instead of cities?
People routinely live in one municipality and work in another; a city’s legal boundary rarely matches where its workers commute, hire, and job-hunt. Metropolitan statistical areas are defined around those commuting patterns, so they match how a job seeker experiences a market — and most of the data is published at the metro level.
Why didn’t the list look at crime rate, weather, or taxes?
Taxes are in the index, but not as a standalone metric. Our wage measures are net of federal, FICA, and state and local income taxes (and then adjusted for cost of living). Weather is not included because it is subjective. While some people would find higher temperatures more desirable, others may not. Crime data at the MSA level can be quite messy, and since it’s not a labor related metric, we made the change to exclude it.
How were the pillars and metrics chosen, and how were they weighted?
Each pillar answers a plain question a worker might ask:
• Pillar 1 – Job Opportunity (20%): Can I find a job here?
• Pillar 2 – Compensation (20%): Will I earn enough to build a good life?
• Pillar 3 – Job Quality & Security (15%): Is the job stable, and does it come with anything?
• Pillar 4 – Career Mobility & Dynamism (15%): Can I move up — and will moving pay off?
• Pillar 5 – Work-Life & Flexibility (15%): What does life look like outside of work?
• Pillar 6 – Economic Opportunity (15%): Does the city work for everyone, not just the average one?
Opportunity and Compensation carry the most weight because they’re the preconditions for everything else. Within each pillar, metrics are weighted equally — except in Pillar 1, where labor-market tightness carries the most weight of any single metric in the index. The complete metric list and every weight are in the methodology companion.
How can a city rank for remote work if the work itself is remote?
The remote/hybrid metric measures the share of a metro’s job postings that offer remote or hybrid work — it’s tied to where the job (the employer) is based, not to where a worker might physically sit. It shows how local employers are offering flexible arrangements. A metro scores well when the jobs being advertised give workers the option to work remotely or hybrid — which is a feature of that local labor market, regardless of where the work ultimately gets done.
Why didn’t cities like New York or Los Angeles — places associated with jobs — rank in the top 25?
Because the index rewards balance. New York and Los Angeles have plenty of jobs and high nominal wages, but once you adjust pay for their high cost of living and taxes, and factor in long commutes, heavy housing burdens, and how broadly the gains are shared, their overall scores fall outside the top 25. It’s the whole point of a worker-centric lens: a place can be great to hire in and still be a hard place to be a worker.
Were political factors or local government policies considered?
No. The index measures outcomes workers experience, not the policy debates behind them.
Can you give more context on the AI exposure metric — what it means and how it’s calculated?
It’s a metric within Pillar 3 (Job Quality & Security) that gauges how exposed a metro’s job composition is to generative AI. Built from Indeed Hiring Lab’s GenAI Skill Transformation Index (from our AI at Work Report 2025), it reflects the share of skills in a typical local posting that GenAI could reshape. Scores run from roughly 40% to 60% and we score it lower-is-better, since less exposure means a more insulated local economy. One caveat: this measures potential task transformation, not job loss.